A common black box for infrastructure admins is Microsoft SQL running in your environment and how much memory it needs. In general, if you can easily afford to allocate more gigabytes of memory to the server running SQL than how many gigabytes large of total database size, then just do it. However, if you want to know more about troubleshooting memory issues in Microsoft SQL, read on.
Sikich had an instance this month where a client was getting an error page when attempting to view reports from Microsoft SQL Reporting Services on a server where the SQL Instance also was. It was an intermittent issue. I immediately thought it might be an issue with memory, but the client had stated they had already purchased and installed more memory into this server than what it originally had.
Upon connecting to the server in question, here is what I saw when launching Resource Monitoring and looking at the Memory tab.
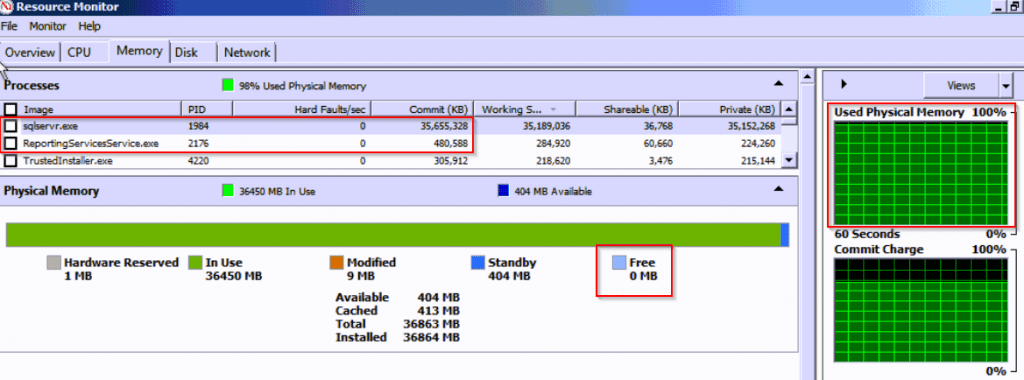
There are multiple places to look in this screen capture, but just see that there is a total of 36GB of memory on this server and all of it is in use, almost entirely by sqlservr.exe (the process that runs the SQL engine). You can also see underneath that ReportingServicesService.exe (the process that runs the task that was failing) is the next highest consumer of memory but only using 1% as much as the SQL engine itself. Also note there is 0MB free memory available to the server. It is safe to say here that the reason the client was having the problem was there was not sufficient memory for the Reporting service.
You may immediately jump to the conclusion that this client needs to purchase even more memory and install it in the SQL Server as it is using everything. Not so fast. Let’s look at database sizes first.

Looking at the largest databases hosted by this instance, we see the largest database is about 43GB, followed by others at 36GB, 17GB, 5GB, and 4GB.
Here is why SQL was using all the memory. SQL tries to be efficient. It will try to page the most common data into memory so queries against it are quick. However, because there is 106GB of data and only 36GB of memory, all the SQL data cannot be paged. SQL determines how much to page by the Memory section on the server properties of each SQL instance.
Each SQL instance has a configurable amount of memory that can be allocated for the SQL engine to use. To get to here, run SQL Server Management Studio, login to your instance, and right click the SQL server and go to properties. From here select the Memory section on the left column.
In this case, the SQL server was set to use the default settings which is a maximum of about 2,000 terabytes worth of memory. I haven’t worked with a client yet that has 2,000 terabytes of memory assigned to one SQL server and may never in my lifetime. This is just set to a crazy high number as to not limit how much memory SQL can use by default. When database sizes are smaller than the total amount of memory in the server, this doesn’t come into play as SQL could page all the data and still have available memory for other things.
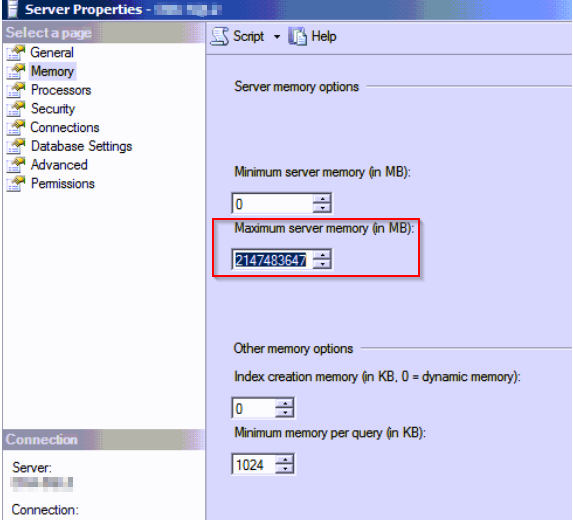
Because the data sizes were more than the available memory, the SQL engine’s instance was consuming all memory here.
It is good practice to limit how much memory the SQL engine can use as the server will need to have available memory to do other tasks (such as reporting in this client’s case or just normal Windows tasks in general). This is one of the steps I do every time I have a new SQL installation. I calculate how much memory is assigned to the server, then subtract 4GB-6GB and then give that number to SQL. The field’s unit is megabytes so be sure to keep that in mind when doing your calculations for how the new value to be put in this field. I reduced it to be able to use 30720MB (30 * 1024MB = 30720MB) or approximately 30GB of memory which will allow 6GB of memory for other things needed by the operating system.
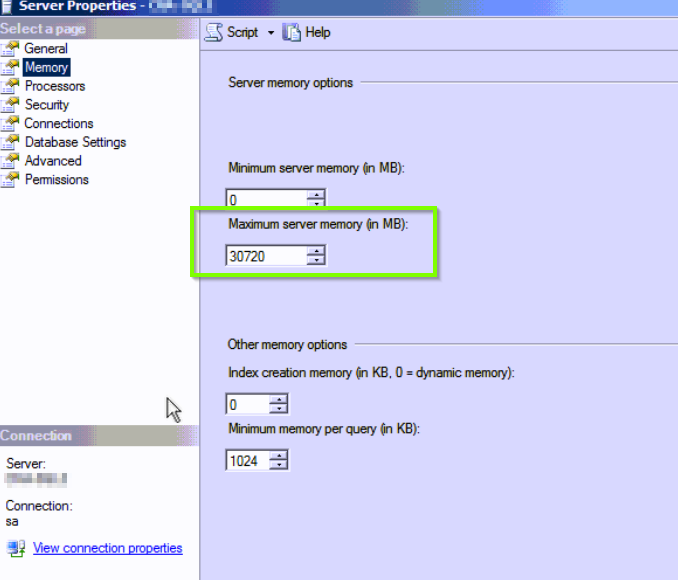
The next step was to see how SQL responds now that it is limited to 30GB of memory. Did it need the 36GB of memory it was using before? Did it need even more?
Back to resource manager we see that sqlservr.exe is using 31,816,264 kilobytes of memory (30.3GB of memory, right around what it was set to use). There is also about 4GB of memory free now. While we took away 6GB of memory from SQL, only 4GB is free to the operating system which indicates that some system processes were immediately needing more memory but SQL was hogging it.
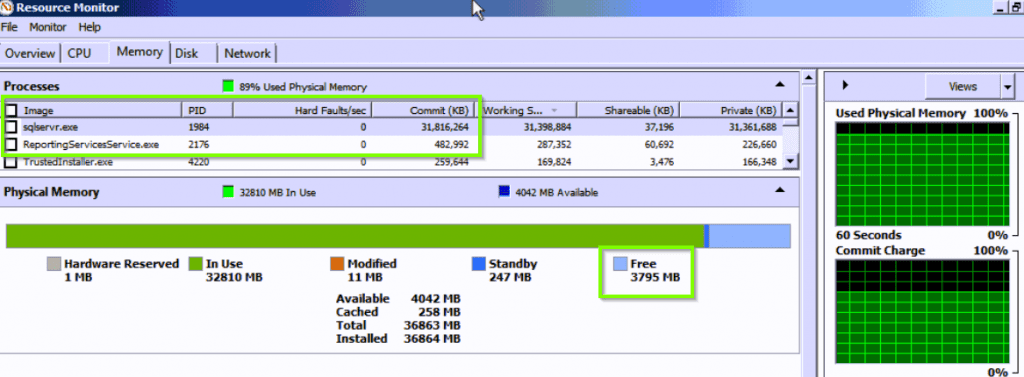
Good news so far. The changes made to the SQL instance has taken effect and memory is available to the operating system. If this isn’t the case, you may need to take an outage and restart your SQL service for the change to take effect.
But will SQL performance suffer? Launch Performance Monitor and add some counters:
- SQLServer: Buffer Manager – Page Life Expectancy
- SQLServer: Memory Manager – Memory Grants Pending
- SQLServer: SQL Statistics – Batch Requests/sec
- SQLServer: SQL Statistics – Compilations/sec
Let it run for a minute or two to be able to calculate some averages. Now let’s dig in.
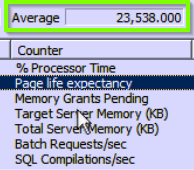
Average Page Life Expectancy
If this number is low then memory pages have a short lifespan which will leave data pages in memory for less time and therefore have more churn of data pages in memory for quick access. A simple way to make sure the correct pages are in memory is to make sure indexes are tuned correctly through a maintenance plan or scheduled TSQL query. This environment already had a maintenance plan that does this every Friday. There is a very long average page life expectancy on this server now, (23,538 seconds, or 292.3 minutes or 6.5 hours) so this is good here. You could potentially have a much lower average page life expectancy of say 5 or 10 minutes and still be okay for your environment.
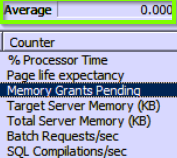
Average Memory Grants Pending
This number should always be zero. Anything larger than that indicates there SQL processes are waiting to happen and there isn’t a way to allow them to happen as the memory will not be released to it. This client is at zero, so this is good here. If you are not at zero, it is a good sign you could use more memory or less commonly you could have queries that have incorrect memory grants.
SQL Compilations Per Second and Batch Requests Per Second
In general, if on average the SQL Compilations are at or less than 10% of the total Batch Requests per second, then SQL is being utilized well and is looking at cached plans instead of being forced to rerun queries against the database. The client’s server was running almost twice that at about 18%-19%. This indicates that while some tuning could potentially be available to be done, for now it may make sense to leave this alone given the other things we found. A lot of time could be spent here scrutinizing to see if cached plans can be reused instead of re-executed.
Remember that we just looked at averages over a period of a couple minutes and determined our position that no we did not need more memory in this server based on what we saw. Obviously if you are looking at your server after hours it may not be indicative of what it really needs.
Also keep in consideration that we only limited one SQL instance for how much memory this instance could use as this server only had one instance of SQL. If your server has more, the memory change would need to be set per instance. We recommend making small changes and seeing how the server and environment handle the change.
Think it might be time to take a deeper look at your server and the best strategic step? Contact the tech experts at Sikich to help!
This publication contains general information only and Sikich is not, by means of this publication, rendering accounting, business, financial, investment, legal, tax, or any other professional advice or services. This publication is not a substitute for such professional advice or services, nor should you use it as a basis for any decision, action or omission that may affect you or your business. Before making any decision, taking any action or omitting an action that may affect you or your business, you should consult a qualified professional advisor. In addition, this publication may contain certain content generated by an artificial intelligence (AI) language model. You acknowledge that Sikich shall not be responsible for any loss sustained by you or any person who relies on this publication.


