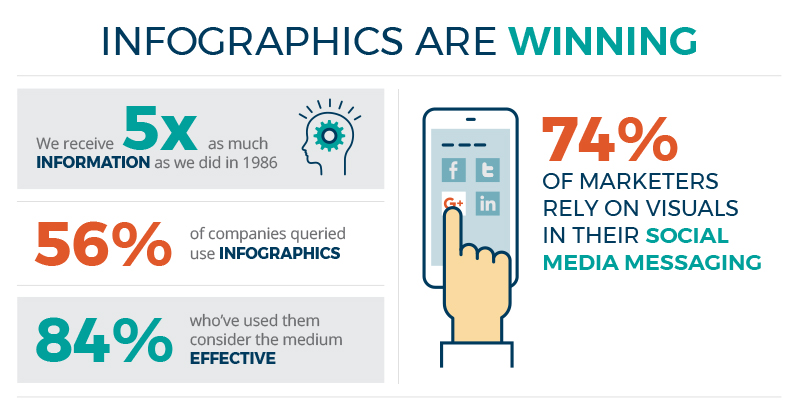
WHAT MAKES AN EFFECTIVE INFOGRAPHIC?
Effective infographics take complex information and organize it into digestible visual messages that relate to the reader. They are a visual shorthand – a quick read to understand the essence of a more in-depth piece. With the convenience of smart phones, viewers are taking in immense amounts of information, resulting in progressively shorter attention spans, and marketers are taking advantage. The trend is staggering.
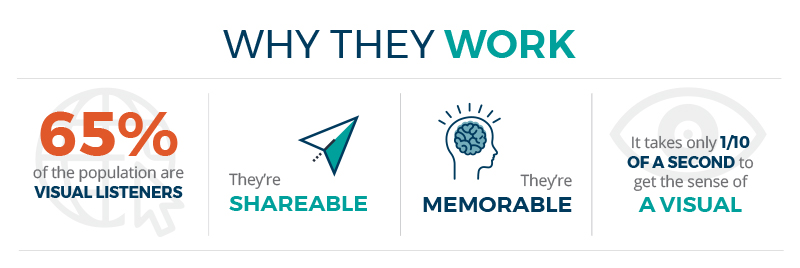
Why do Infographics Work?
Infographics work because 90% of the information transmitted to the brain is visual. Visuals improve learning and retention by 400%. A viewer may skim a 300 word article but a summarized visual data call-out would highlight the important points faster and are more likely to be retained.
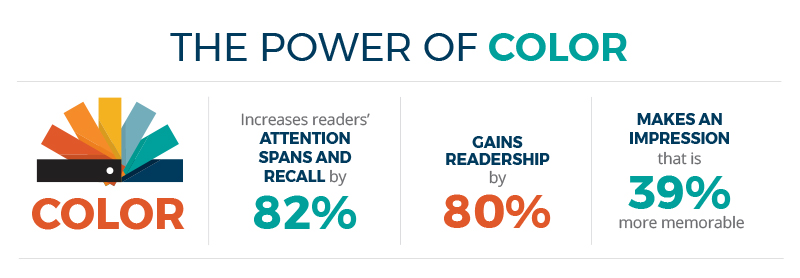
HOW COLOR PLAYS AN IMPORTANT ROLE
Color is essential because it captures attention, emphasizes critical information, gains readership and ultimately helps to boost sales. The decision whether to read or reject pamphlets and direct mail pieces is made by readers in just 2.5 seconds. Using color can keep your materials on the desk and out of the trash.
CREATING AN EYE-CATCHING DESIGN
The layout of your infographic must speak to your audience and capture their attention. For example, the way you communicate to engineers will be different than the way you communicate to a group of artists. These basic rules will help drive an effective design.

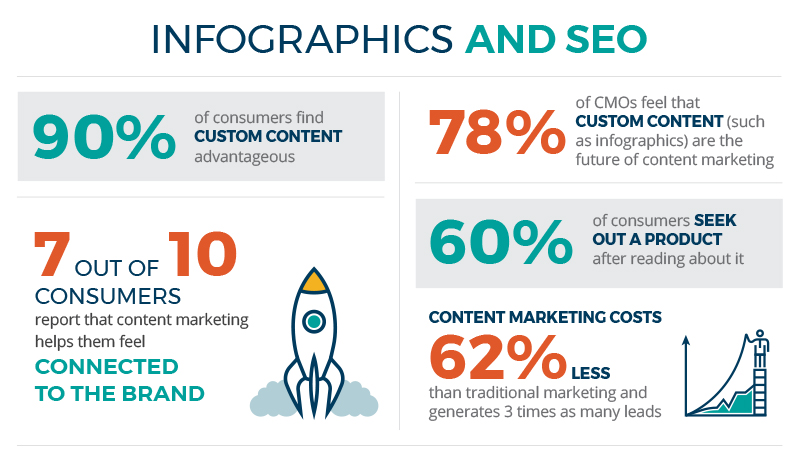
WHY INFOGRAPHICS SHOULD BE A PART OF YOUR SEO STRATEGY
Infographics are LIKED and shared 3-times more than other types of content, so why wouldn’t you use them? Some say infographics are overused, but if they are done correctly – engage your audience, provide some entertainment value and are well designed, they have been proven to help SEO content marketing efforts.
Want to read more?
Interested in hearing more from Sikich’s Marketing and Design experts? Check out their Facebook page and like for more of the top trending news in the marketing and design industry.
Sources:
https://www.forbes.com/sites/cherylsnappconner/2017/10/19/the-data-is-in-infographics-are-growing-and-thriving-in-2017-and-beyond/
https://www.office.xerox.com/latest/COLFS-02UA.PDF
https://blog.hubspot.com/marketing/infographics-for-seo-strategy#sm.0001n59gc4xcvecuxhj1gu6fvjdbc